

Hot Lots #2: Covid-19 "Vaccines", Decreased Live Births, Excess Mortality, and Population Decline.
How they are linked.

In this video Max Schmeling presents his groups’ latest data analysis concerning batch to batch variation with Pfizer/BioNTech’s BNT162b2 gene therapy product in Denmark and Sweden.
1. Adverse Event Reports (SAEs) vary by batch.
Below is a summary slide with findings from Denmark reported 10/13/2023 by Schmeling, et al on the left and updated 8/19/2024 Danish and new Swedish data analysis on the right, Manniche, et al.
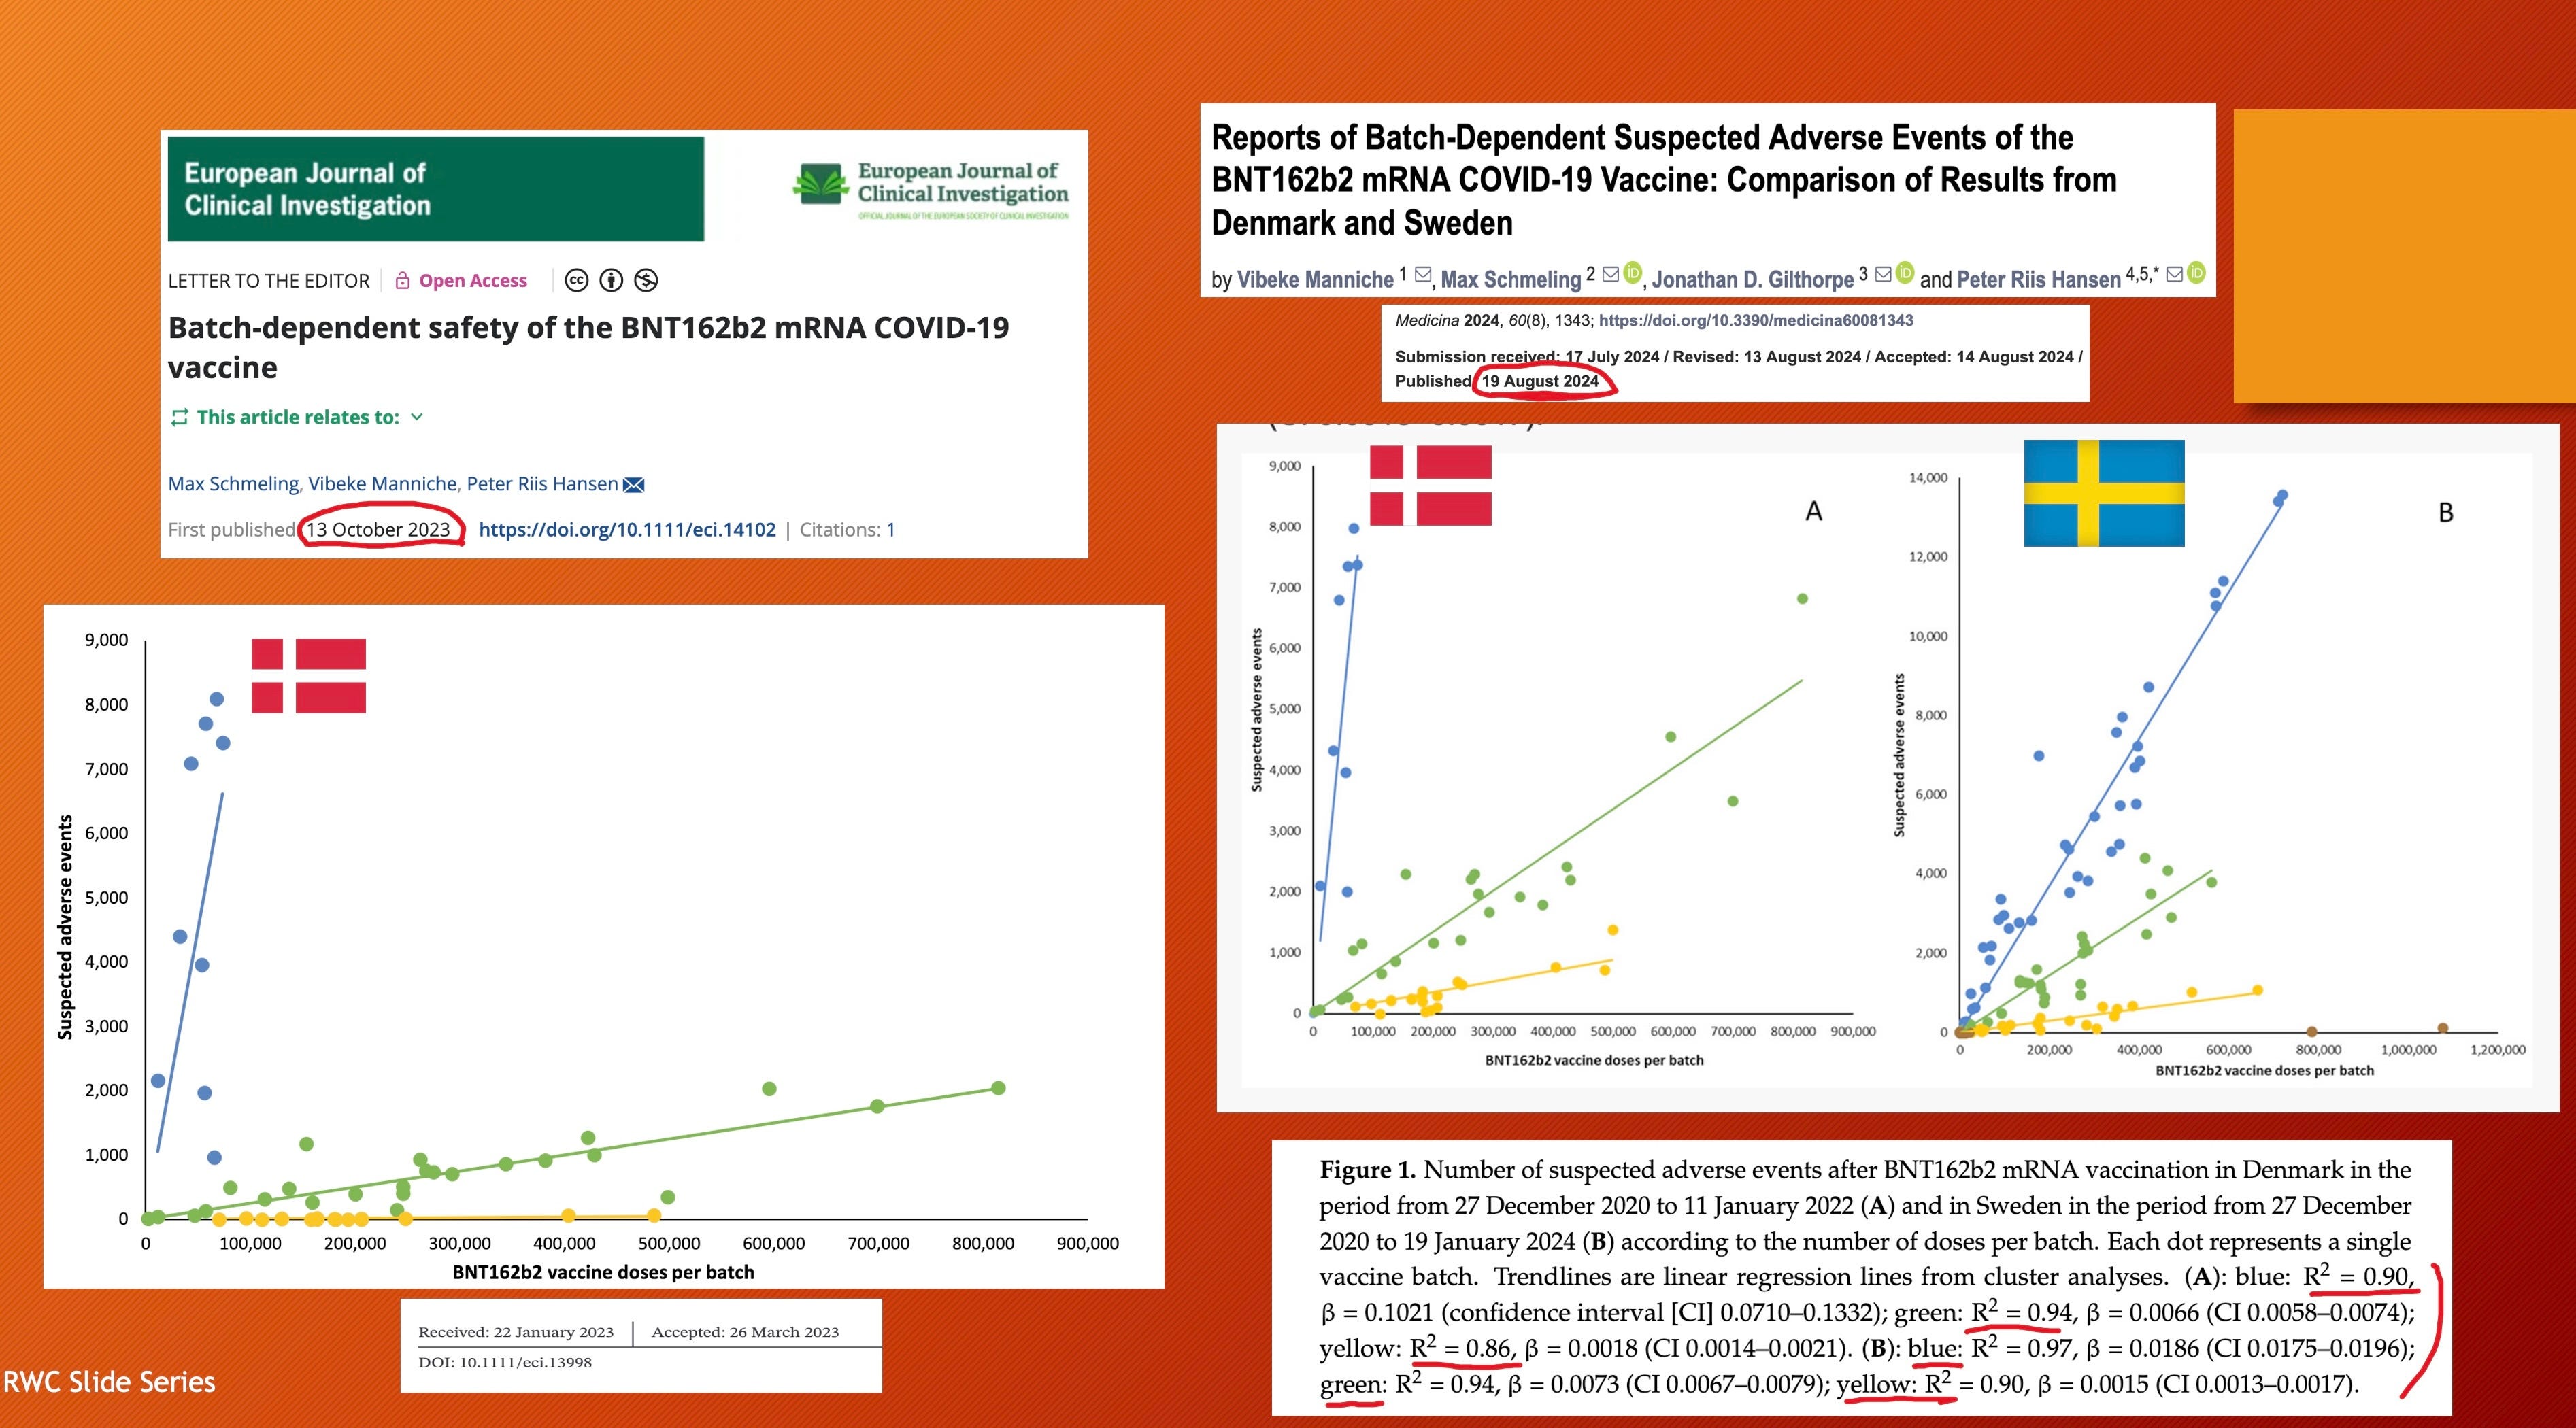
The updated Danish data on the right shows increased slope of the blue, green and yellow clusters compared with the 2023 data set that is probably related to a “catch up” in data collection and filing. The Swedish data shows similar clustering.
Hot lots tended to be released early on and SAEs were associated with increasing batch size. According to the authors 99% of the batches listed were injected so there is no significant number of unused vials.
Below: VAERS data is also has non random distribution of Hot Lots. Non-randomness is key.
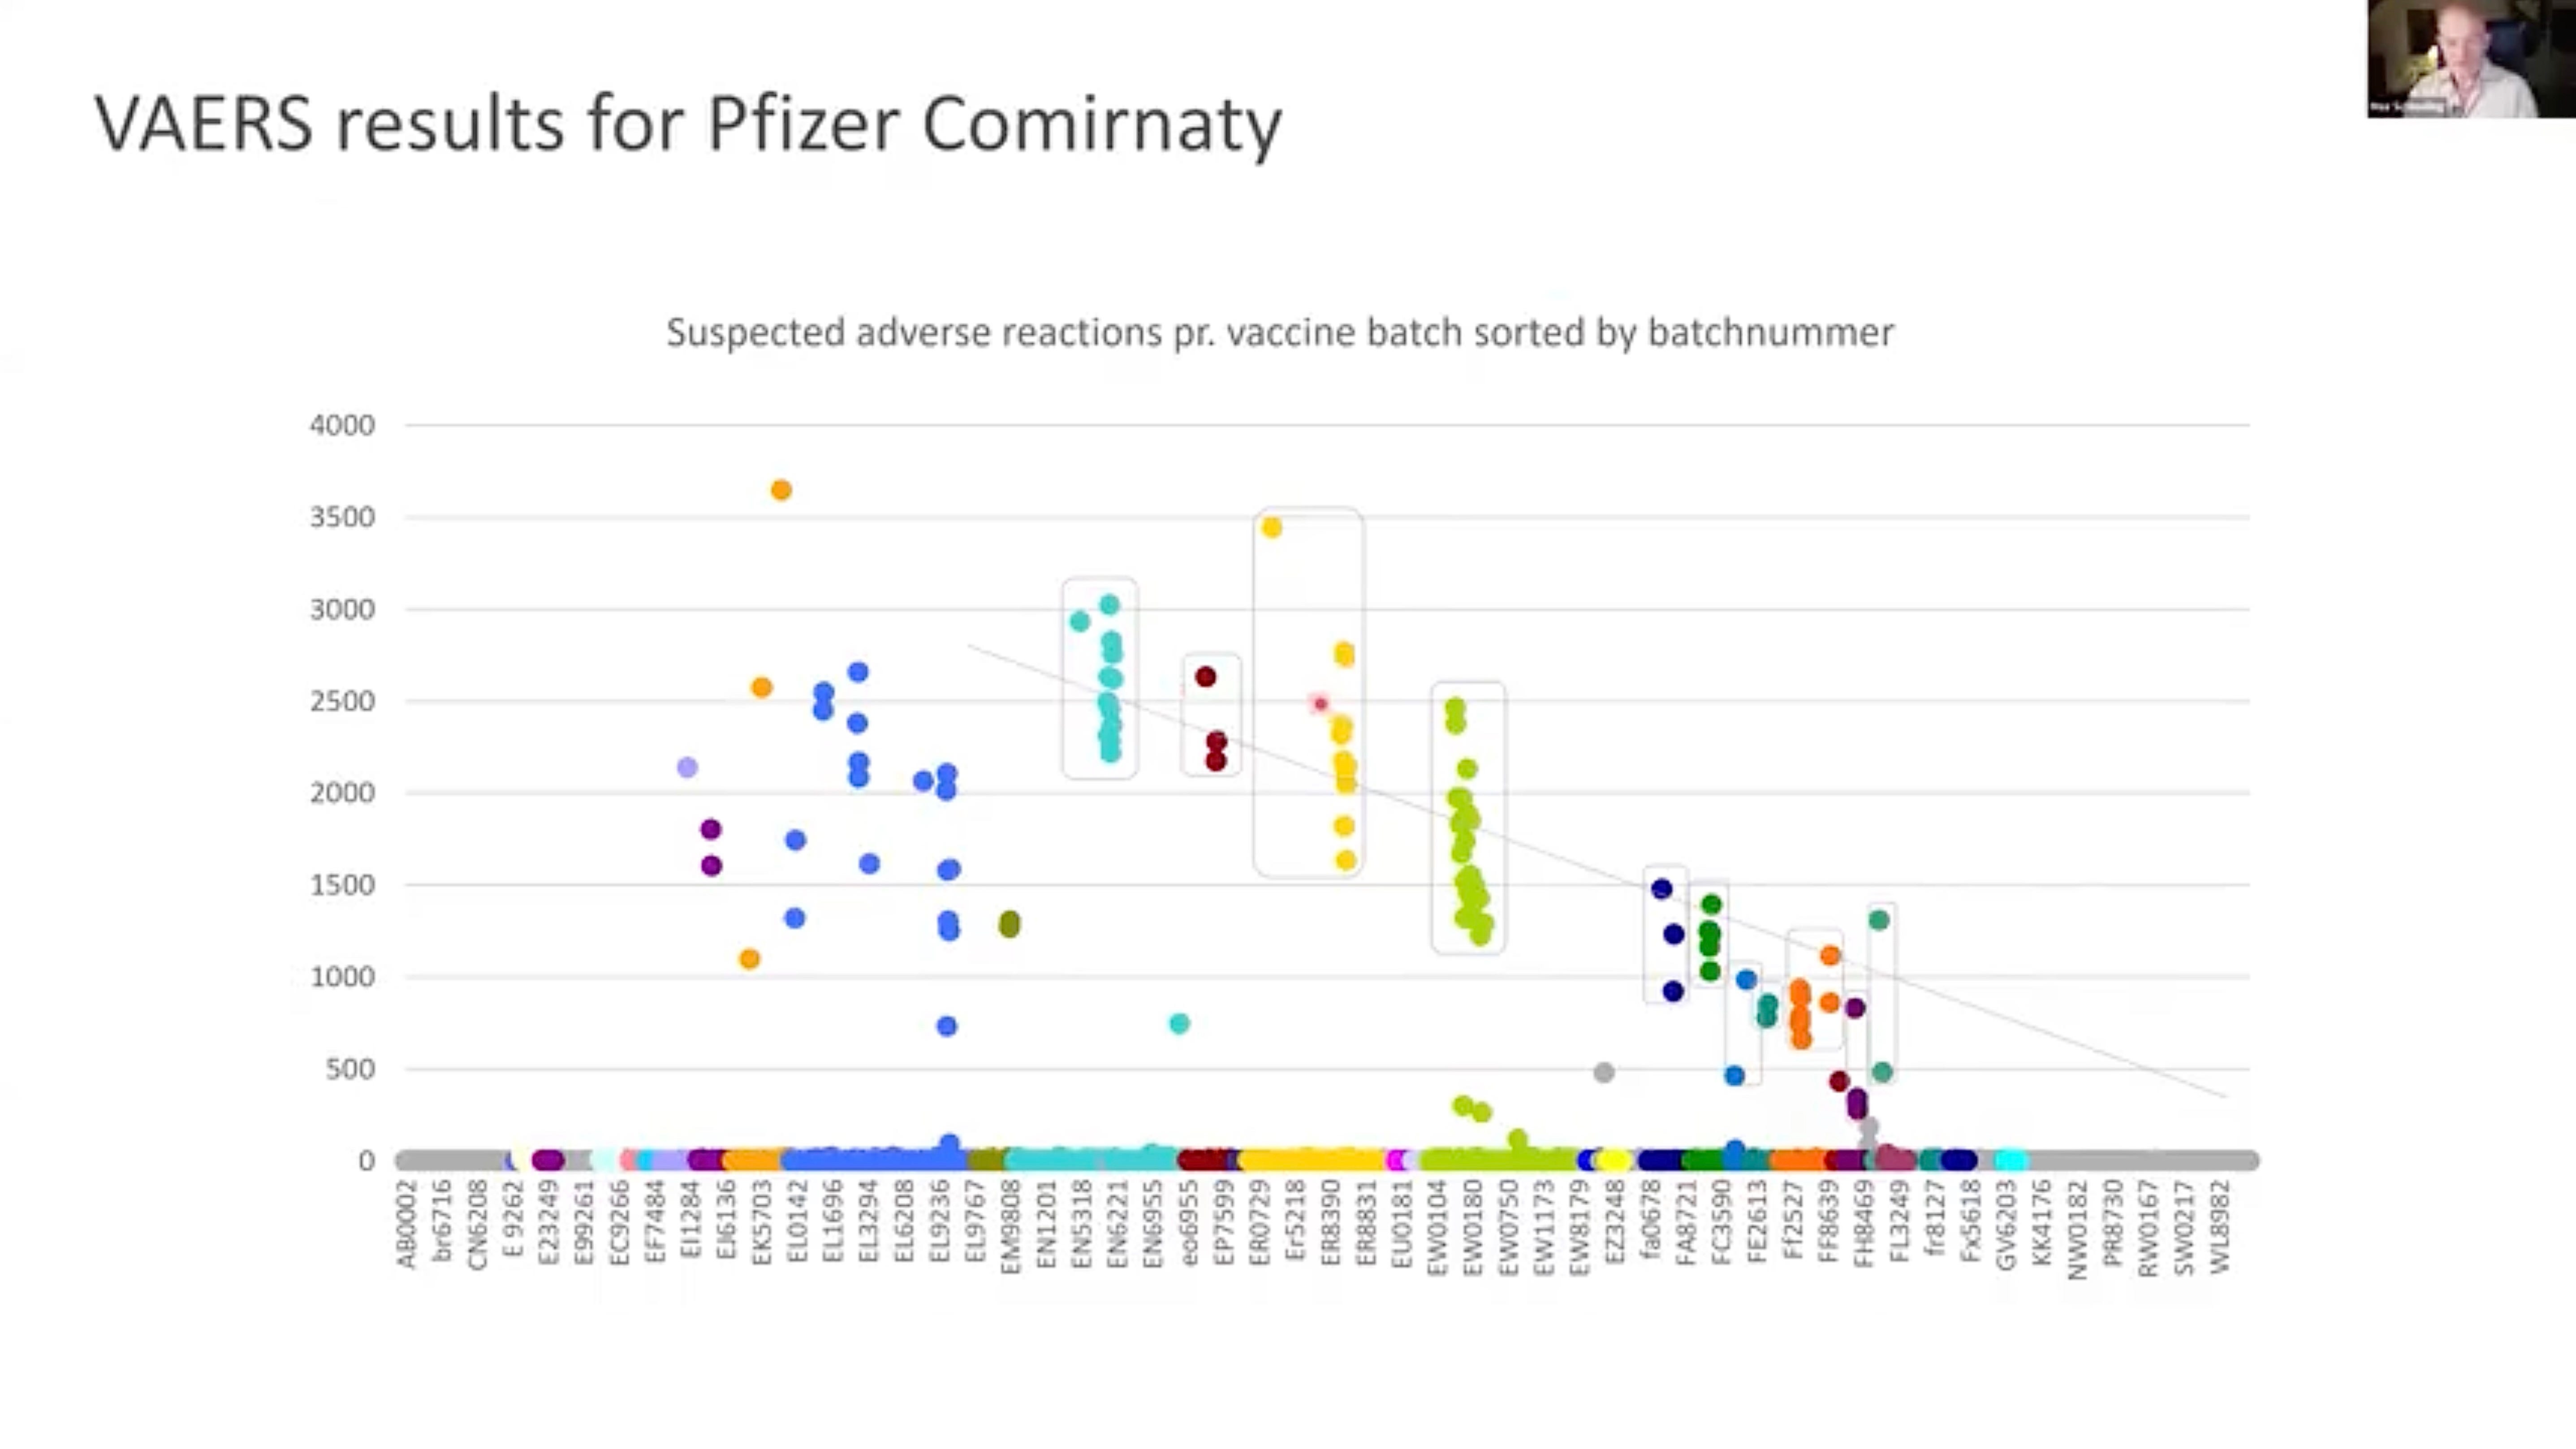
2. A chronological pattern of Declining Adverse Event Reporting was found in Denmark and Sweden.
Specific batches are identified along the x-axis in the graph below. This plot approximates a time series analysis but uses the chronological order of lot numbers showing a drop in total SAEs, severe SAEs and deaths after the first six to eight batches.

3. A chronological pattern of Adverse Event Reporting was also found in US and Territory data in VAERS using time series analysis.
US and Territory data is given in doses injected per month and adverse event reports (SAEs) by month of injection as a function of time. It is important to match the SAEs with the month of injection rather than month of onset, month of report or other points in time.
The graph below is a plot of time series data showing declining interest by the public as indicated by the white line. The peak acceptance was in April of 2021 then declined steeply thereafter.
The yellow data plotted is the number of all doses of all “vaccines” administered by month scaled from 10-100 million doses. The black plot are the number of adverse reports in VAERS for US and Terr. plotted using the secondary y-axis on the right scaled from 0-300,000.

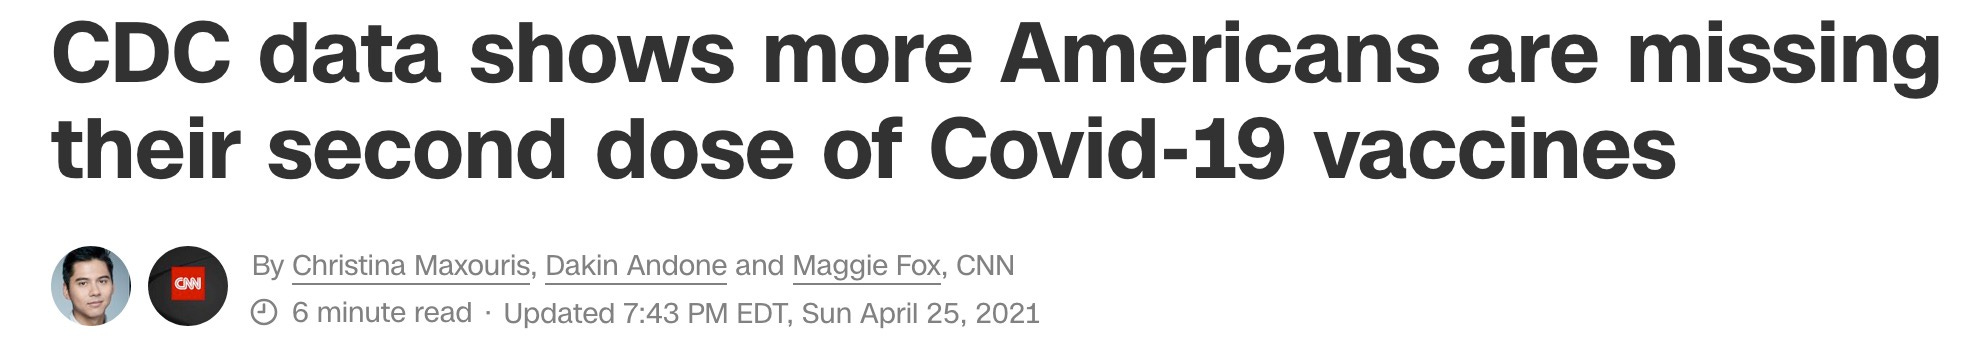
The rejection of these products occurred early on as millions failed to receive a second dose.
As the number of doses increased the reporting of adverse events followed closely but with a widening gap between dose volume and number of SAE reports for subsequent formulations suggesting a change in formulation or reporting/recording.
4. The Danish and Swedish data found 85-90% of the adverse event reporting in the first batches was by women.
Most reported SAEs were for women, who comprised approximately 70% and 75% of all SAE reports in Denmark and Sweden, respectively, during the study period. In both countries, women represented 85–90% of SAE reports in the early phase of BNT162b2 vaccine roll-out, where high SAE rate batches were apparent.
In the VAERS data from US and Terr. women reported almost 80% of the Adverse Events in the first month of the “vaccination” program.
Pfizer Document 5.3.6 from 2/28/2021 reported 70%+ adverse events were in women and throughout the subsequent reporting periods. While women have more adverse events men have a higher fatality rate.
In the video below the Schmeling, et al. data are discussed with Emerald Robinson and Naomi Wolf emphasizing women’s health issues.
We also talk about the Process 1 (RT-PCR) BNT162b2 formulation used in the phase 2/3 clinical trial and the untested Process 2 (E. coli Plasmid DNA) formulation used after the Emergency Use Authorization was granted and how this shift may have produced the Hot Lots.

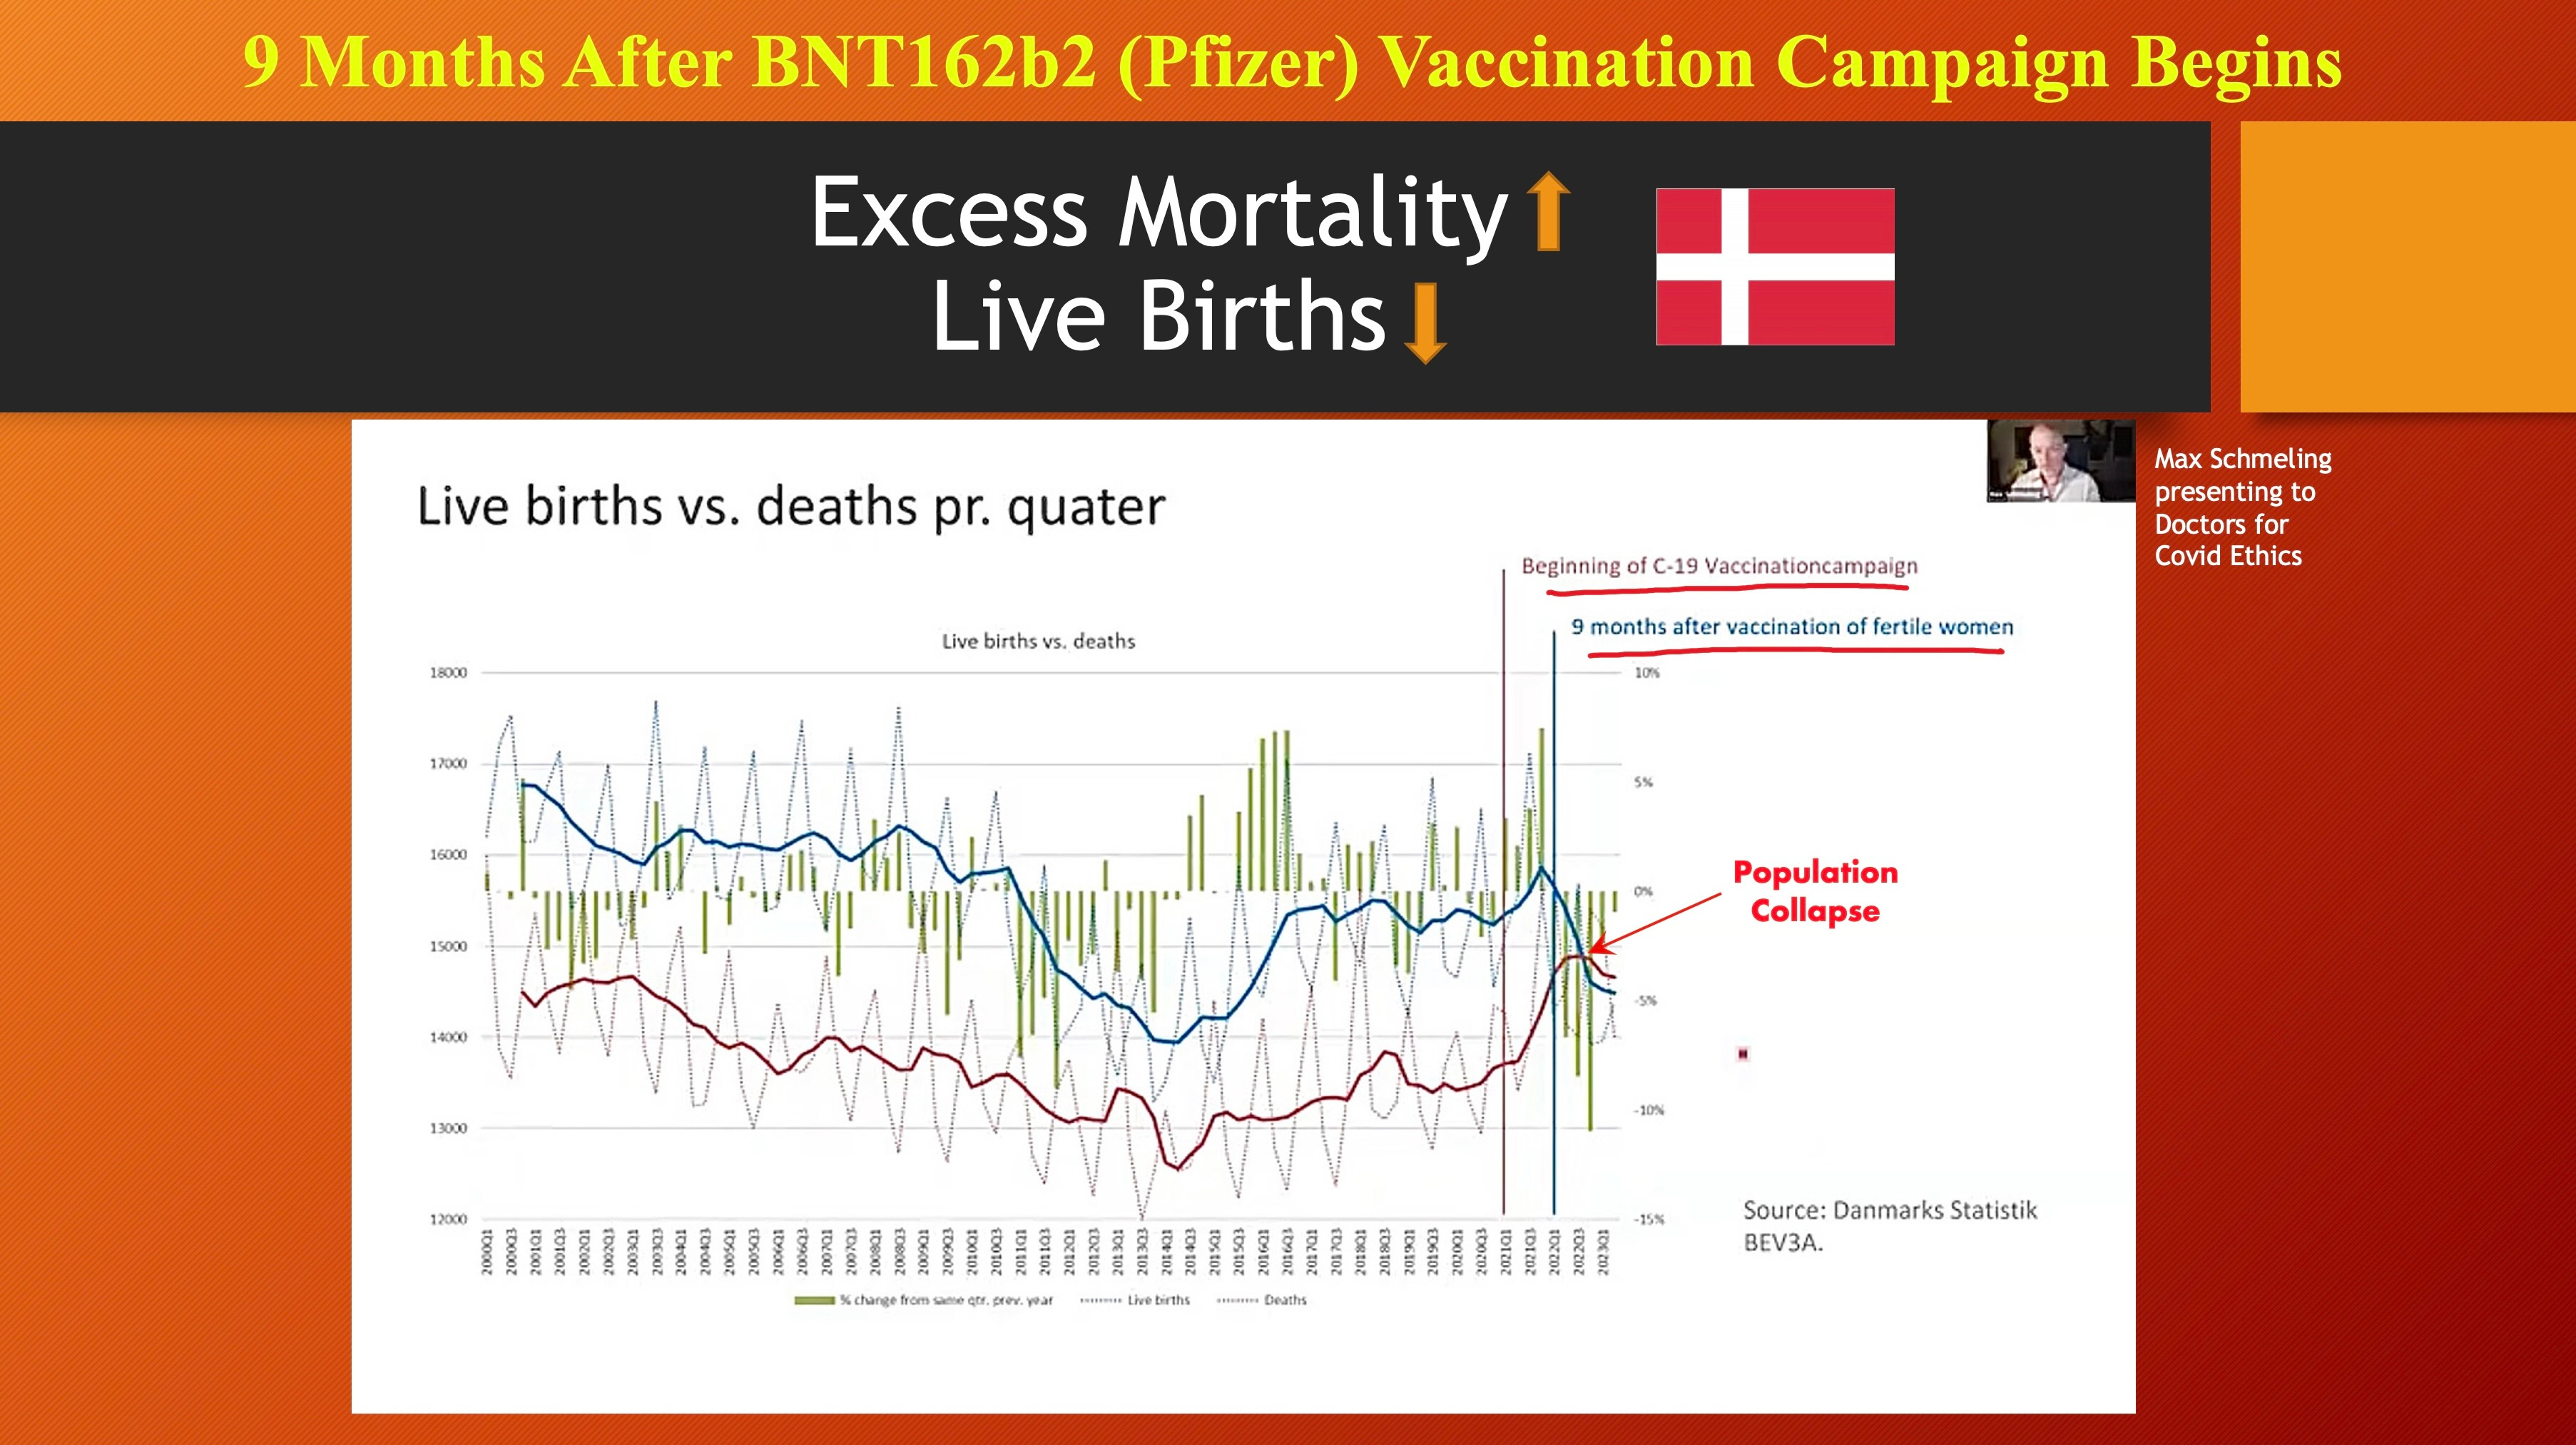
5. Rising excess mortality and declining live births = depopulation.
Decreased births:
The graph below is from Max Schmeling (red arrow and text added). Declining live births combined with excess mortality leads to a decline in population.
These findings are consistent with earlier findings of declining live births in Switzerland and other countries.
Nine Months Post-COVID mRNA “Vaccine” Rollout, Substantial Birth Rate Drops in 13 European Countries, England/Wales, Australia, and Taiwan.

Switzerland has live birth data going back 150 years. Never has such a drop in birth rate occurred as it did 9 Months following rollout of the mRNA drug therapy From Beck and Vernazza (Beck Report).
Excess mortality:
Excess mortality has been identified in multiple countries. One analysis calculated 1,282,141 “man-made” deaths from the Covid response in the US.
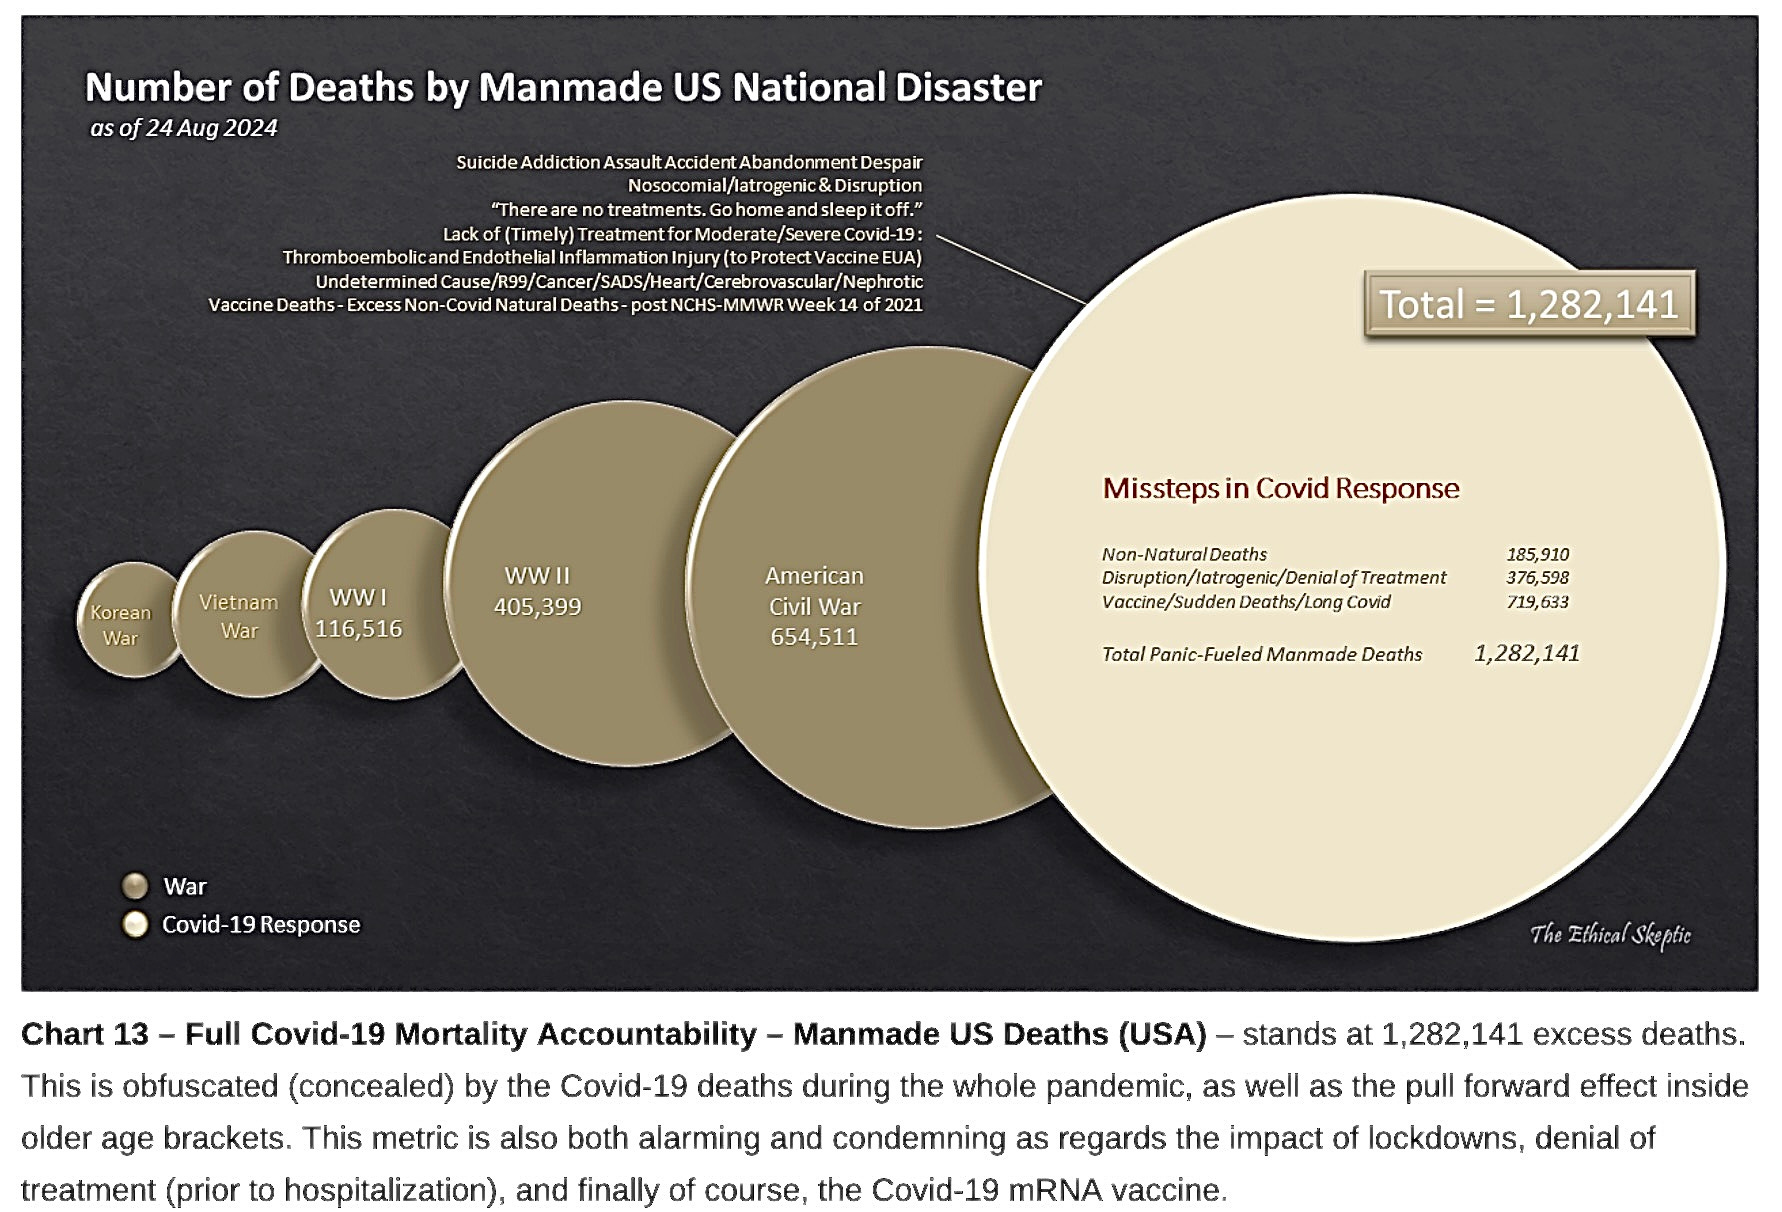
For the full analysis click here Ethical Skeptic
Worldwide the number is over 30 million according to Denis Rancourt’s detailed work.
Our calculated excess mortality rate (0.392 ± 0.002 %) corresponds to 30.9 ± 0.2 million excess deaths projected to have occurred globally for the 3-year period 2020-2022, from all causes of excess mortality during this period.
Additional source: Dowd, Dowd update
6. Is the goal to reduce population?
Perhaps, but we do not know what the motivation has been and for now are left to speculate about why these things have happened and who the decision makers were. There have been signs that responsibility diffusion is built in.
Diffusion of responsibility is a sociopsychological phenomenon whereby a person is less likely to take responsibility for action or inaction when other bystanders or witnesses are present. Considered a form of attribution, the individual assumes that others either are responsible for taking action or have already done so.
https://en.wikipedia.org/wiki/Diffusion_of_responsibility#Workplace
For the USA, population decline in the short term is unlikely because the loss of citizens is more than made up by illegal migrants who are not “vaccinated” (Turbo Replacement).
World population is a different story as mass migration causes population declines in source countries.


Q: Statement of fact or “gaffe”?
A: Probably a gaffe.
Unvaccinated illegal immigrants will more than make up for the loss of US citizens as they get fast tracked into free housing, free health care, jobs and citizenship.


CDC, the Chronic Disease Corporation, and it's cohorts the NIH, the FDA and the USDA in reality seem to be mechanisms for the culling of the general populace and also driving the reproductive health of the same.