US Disability Data
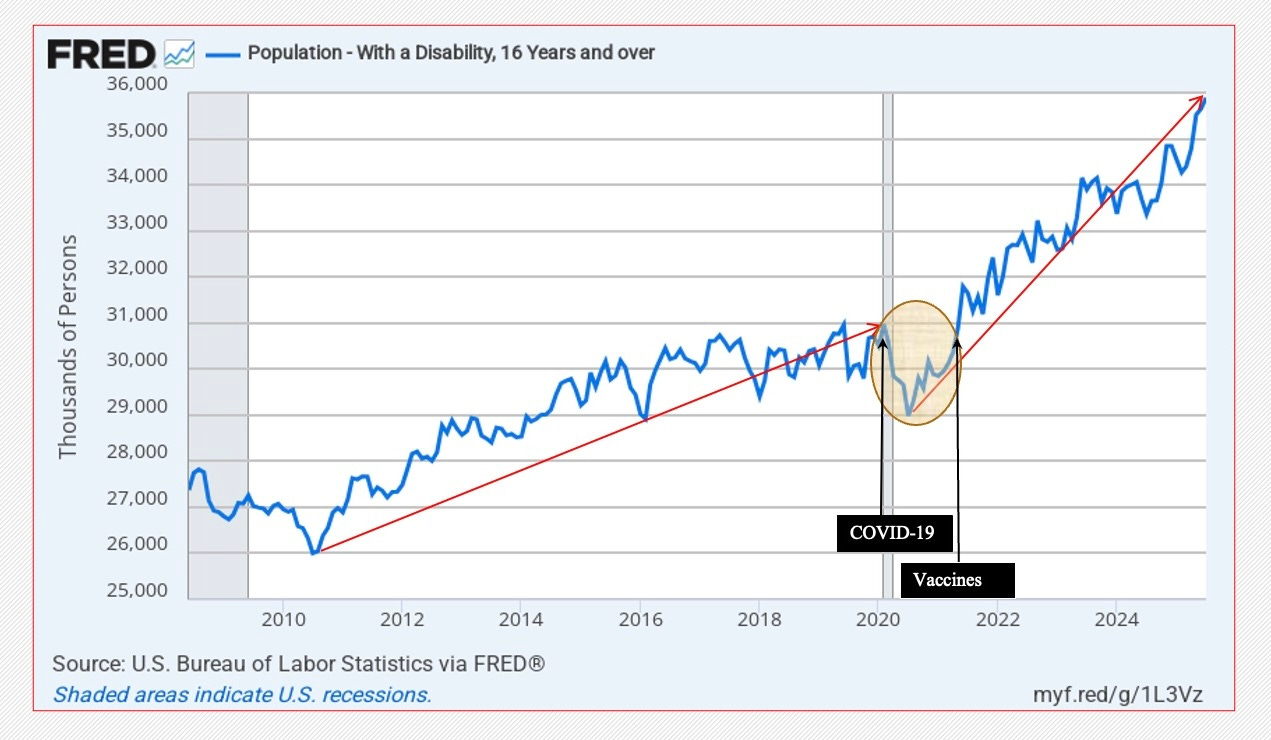
The long term upward trend has accelerated since mass vaccination began and women are disproportionately represented although men are disproportionately represented in the fatality category.

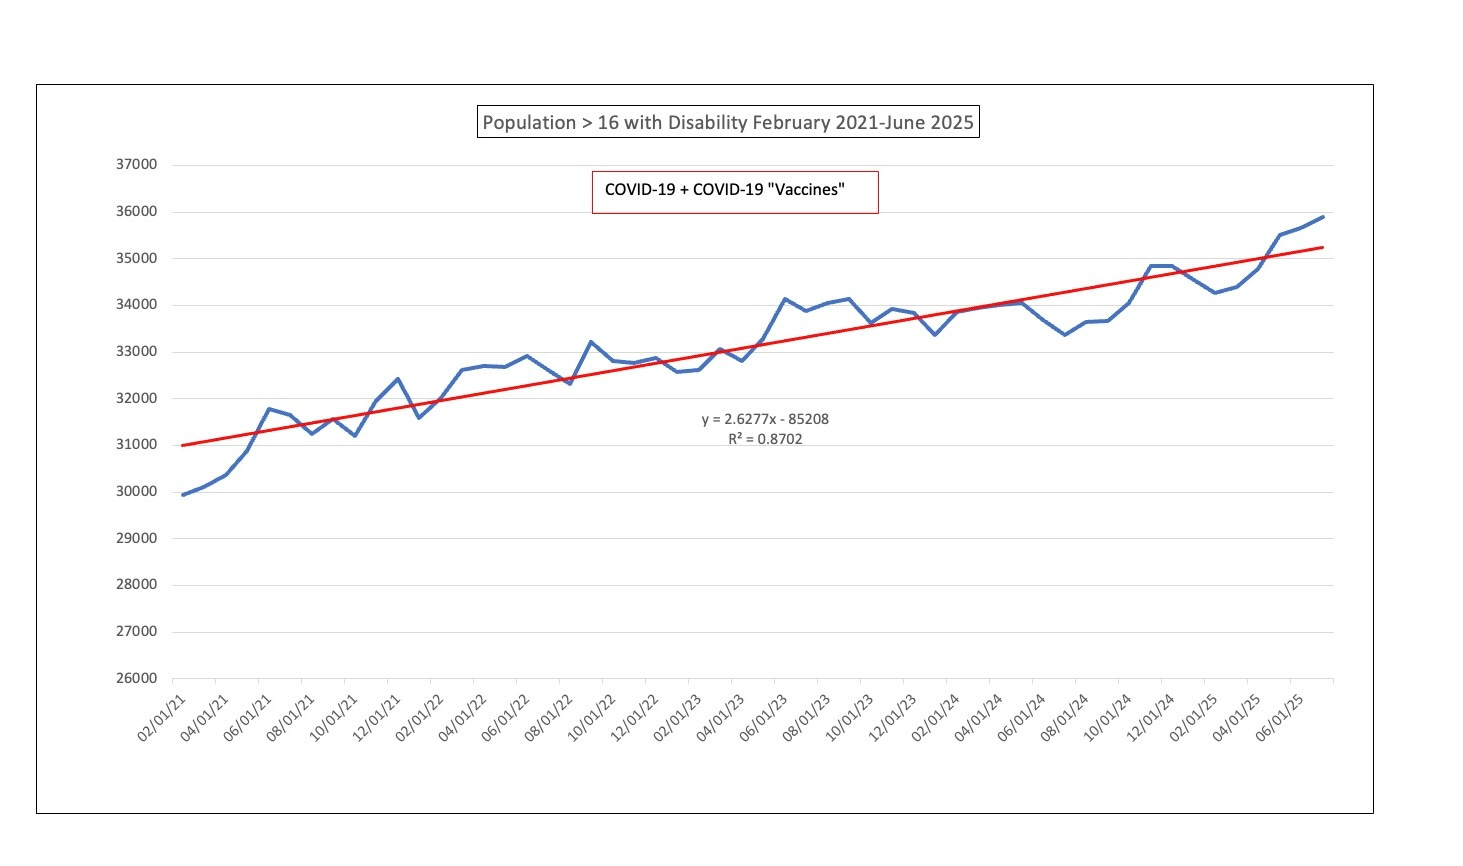
Data from the the U.S. Bureau of Labor Statistics on disability is shown on the modified graph above. The red lines connect low to high points. The shaded oval defines an inflection in the data. Population data should be assumed to be multifactoral in general but historic events took place in the time period from 2020 to 2025.
One of these events concerned the unprecedented injection of experimental gene therapy products never before used in humans. The Pfizer product, BNT162b2 Version 9 Process 2 did not go through animal testing much less clinical trials in humans. BNT162b2 Version 9 Process 1 had very limited testing of a few months rather than the required 2 years as planned. The Process 2 product contains high levels of bacterial DNA contamination.
As of May 10, 2025, 676,728,782 COVID‑19 vaccine doses have been administered in the United States — that represents about 68% of the doses that had been distributed (984,444,295 total) usafacts.org.
Here’s a breakdown to clarify:
Doses distributed: ~984 million
Doses administered (i.e. given to people): ~677 million (~68% utilization rate) usafacts.org
This administration count includes all doses given—primary series, boosters, and additional doses—distributed across all age groups in the U.S.”
However, the public began rejecting the “vaccines” in Spring 2021 in spite of a massive propaganda campaign and coercion. Many received dose 1 and never went back for a second.
Adverse event report volume correlates with vaccination volume as shown on the plot below.
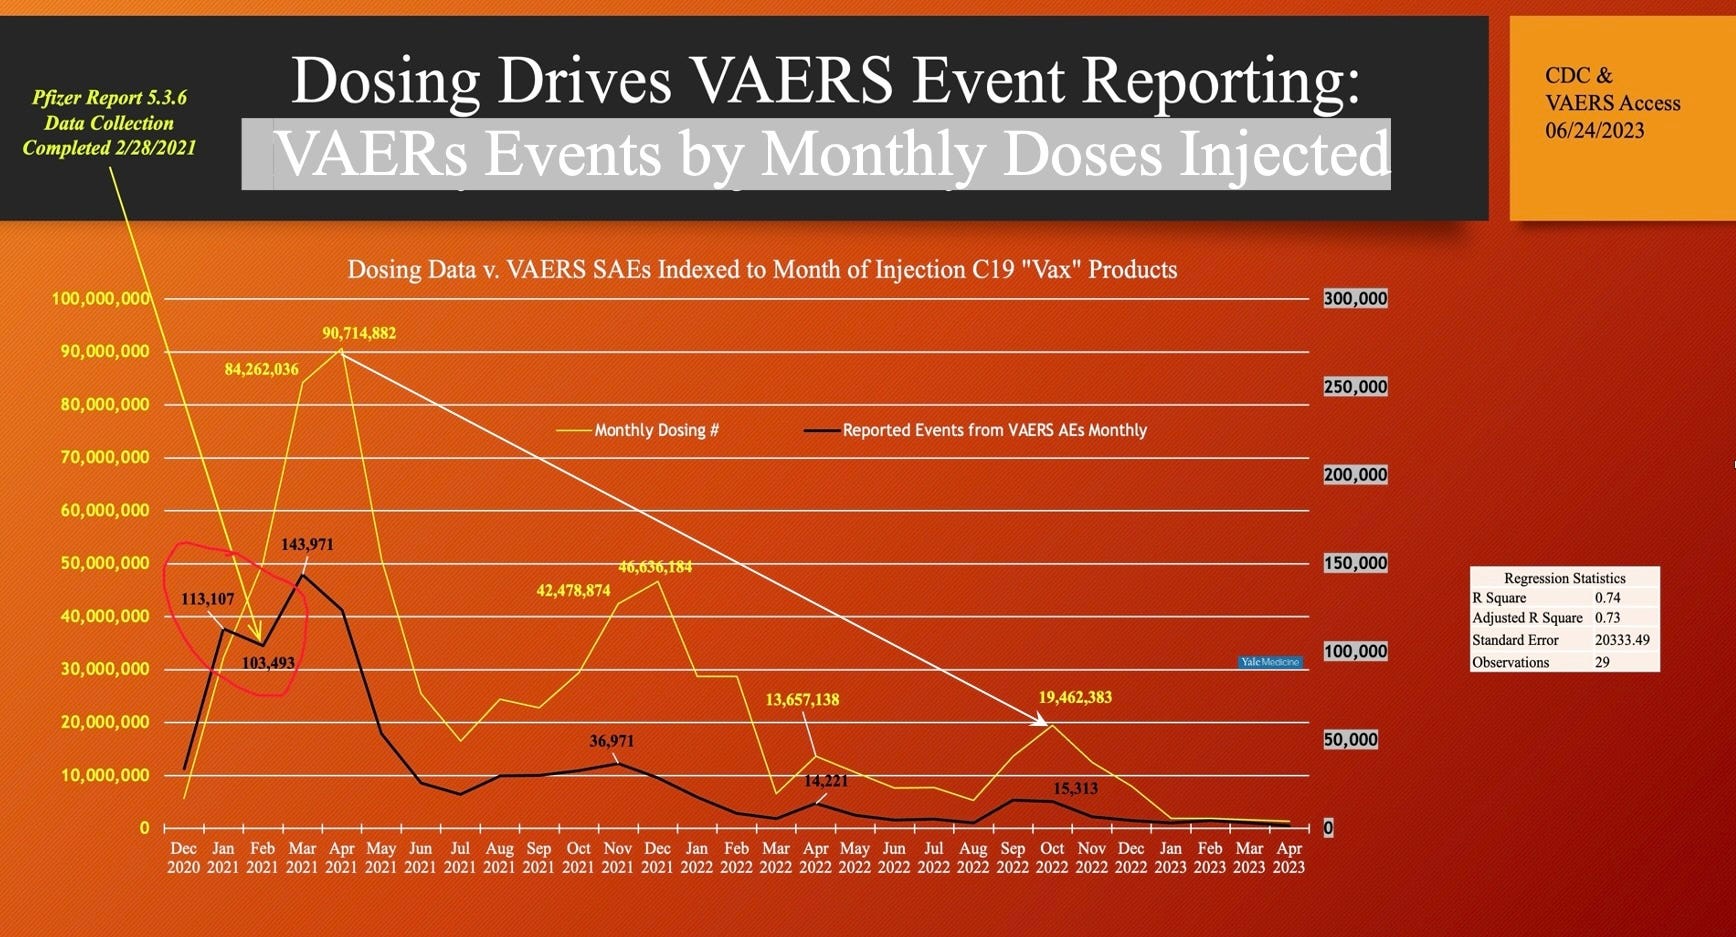
Word of mouth overpowered the media push that was possibly subsidized by tax dollars.
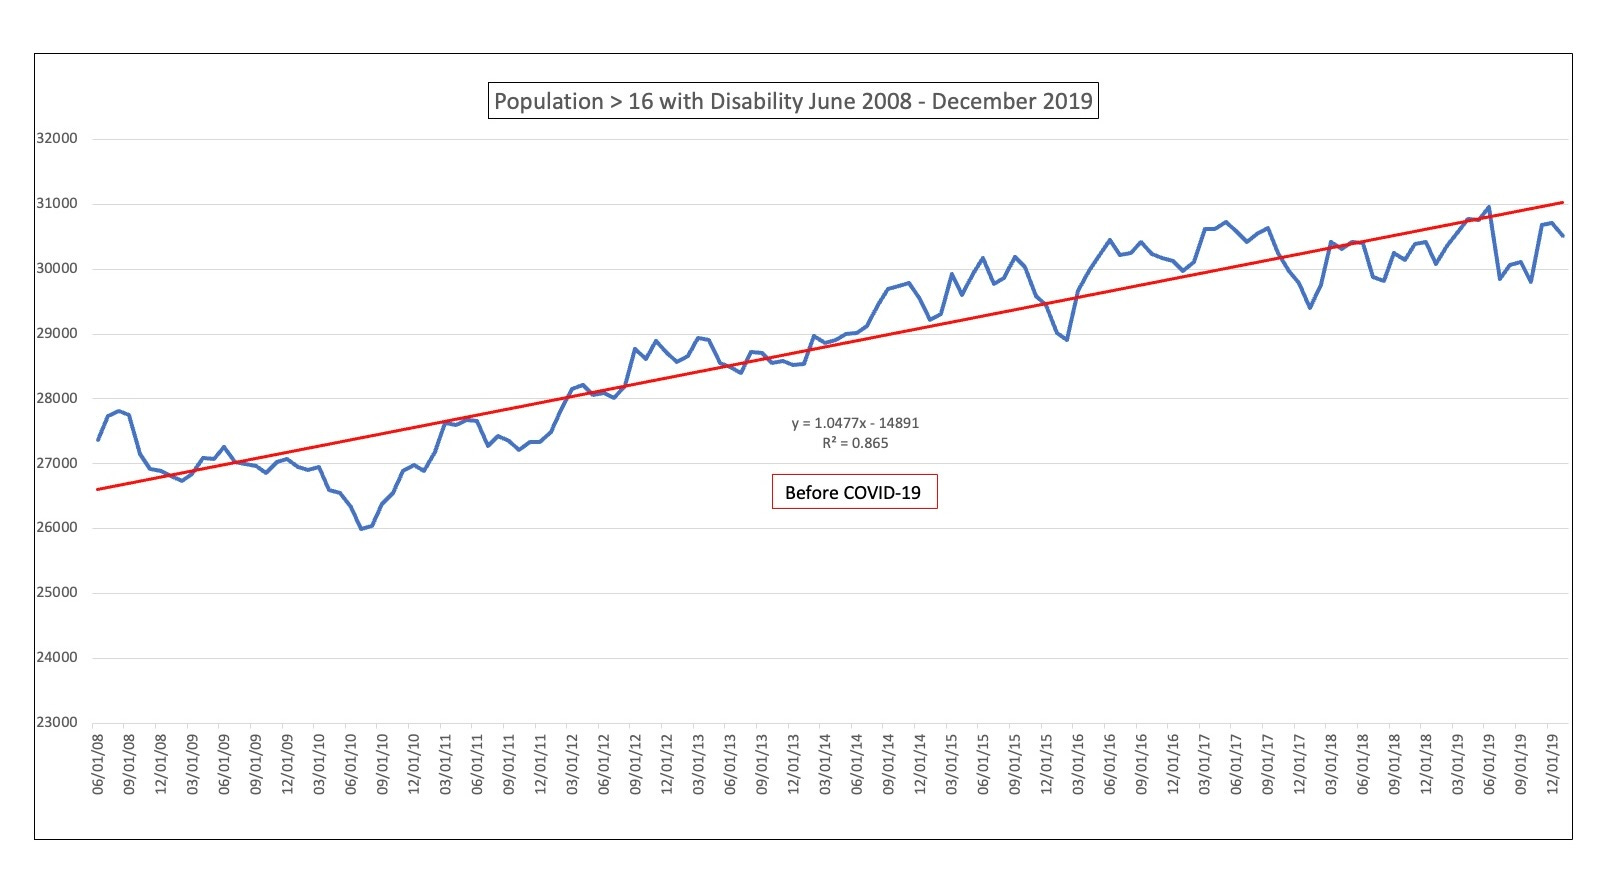
Below is the trend line for number of disabled people in thousands (Y-axis). About 3.3 million persons were added during this time period of 11 years 6 months.
COVID-19 arrived in 2020. The graph below corresponds to the shaded oval in the top graph a represents the “COVID-19/Flu Year, 2020”.
The long term trend of increasing numbers of persons >16 with disability over 16 reversed course dropping 617,000.
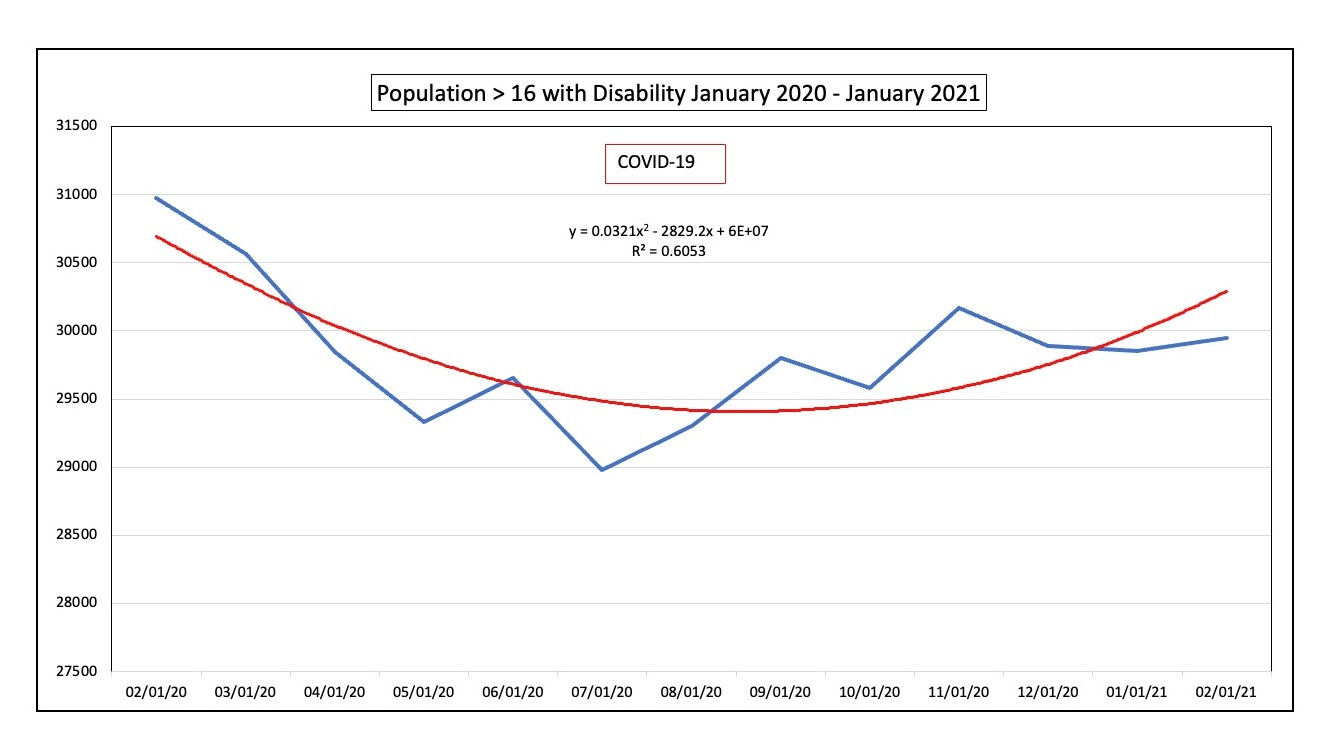
After release of the modRNA “vaccines” the trend again reversed but accelerated compared with the trend before COVID-19. There were almost 6 million new disabled persons after mass “immunization” launched Mid December of 2020.
Women are disproportionately affected by disability after COVID-19 vaccination.
Semmler, et al. published the first of two papers analyzing what they called of Post-Acute COVID-19 Vaccination Syndrome (PACVS). This first paper from 2023 Altered Blood Markers identified laboratory abnormalities found in subjects suffering from “vaccine” injuries. The second paper in 2024 Clinical and Diagnostic Feature of PACVS looked at the clinical findings in this cohort.
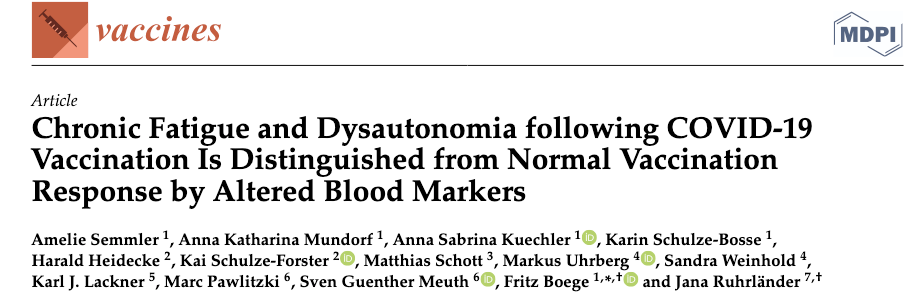
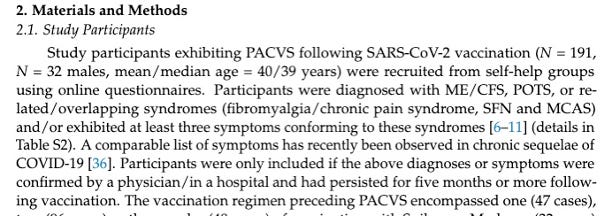
83% of the 191 subjects of this study were females, not very far from the numbers reported by Manniche, et al. (below).
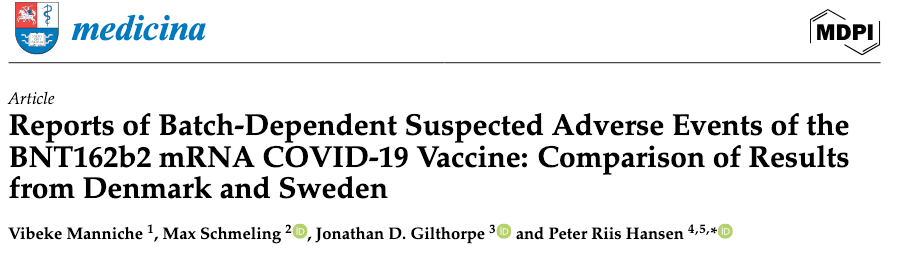
“…women represented 85-90% of SAE reports [Serious Adverse Events] in the early phase of BNT162b2 [Pfizer] vaccine roll-out…”
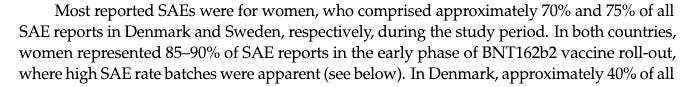
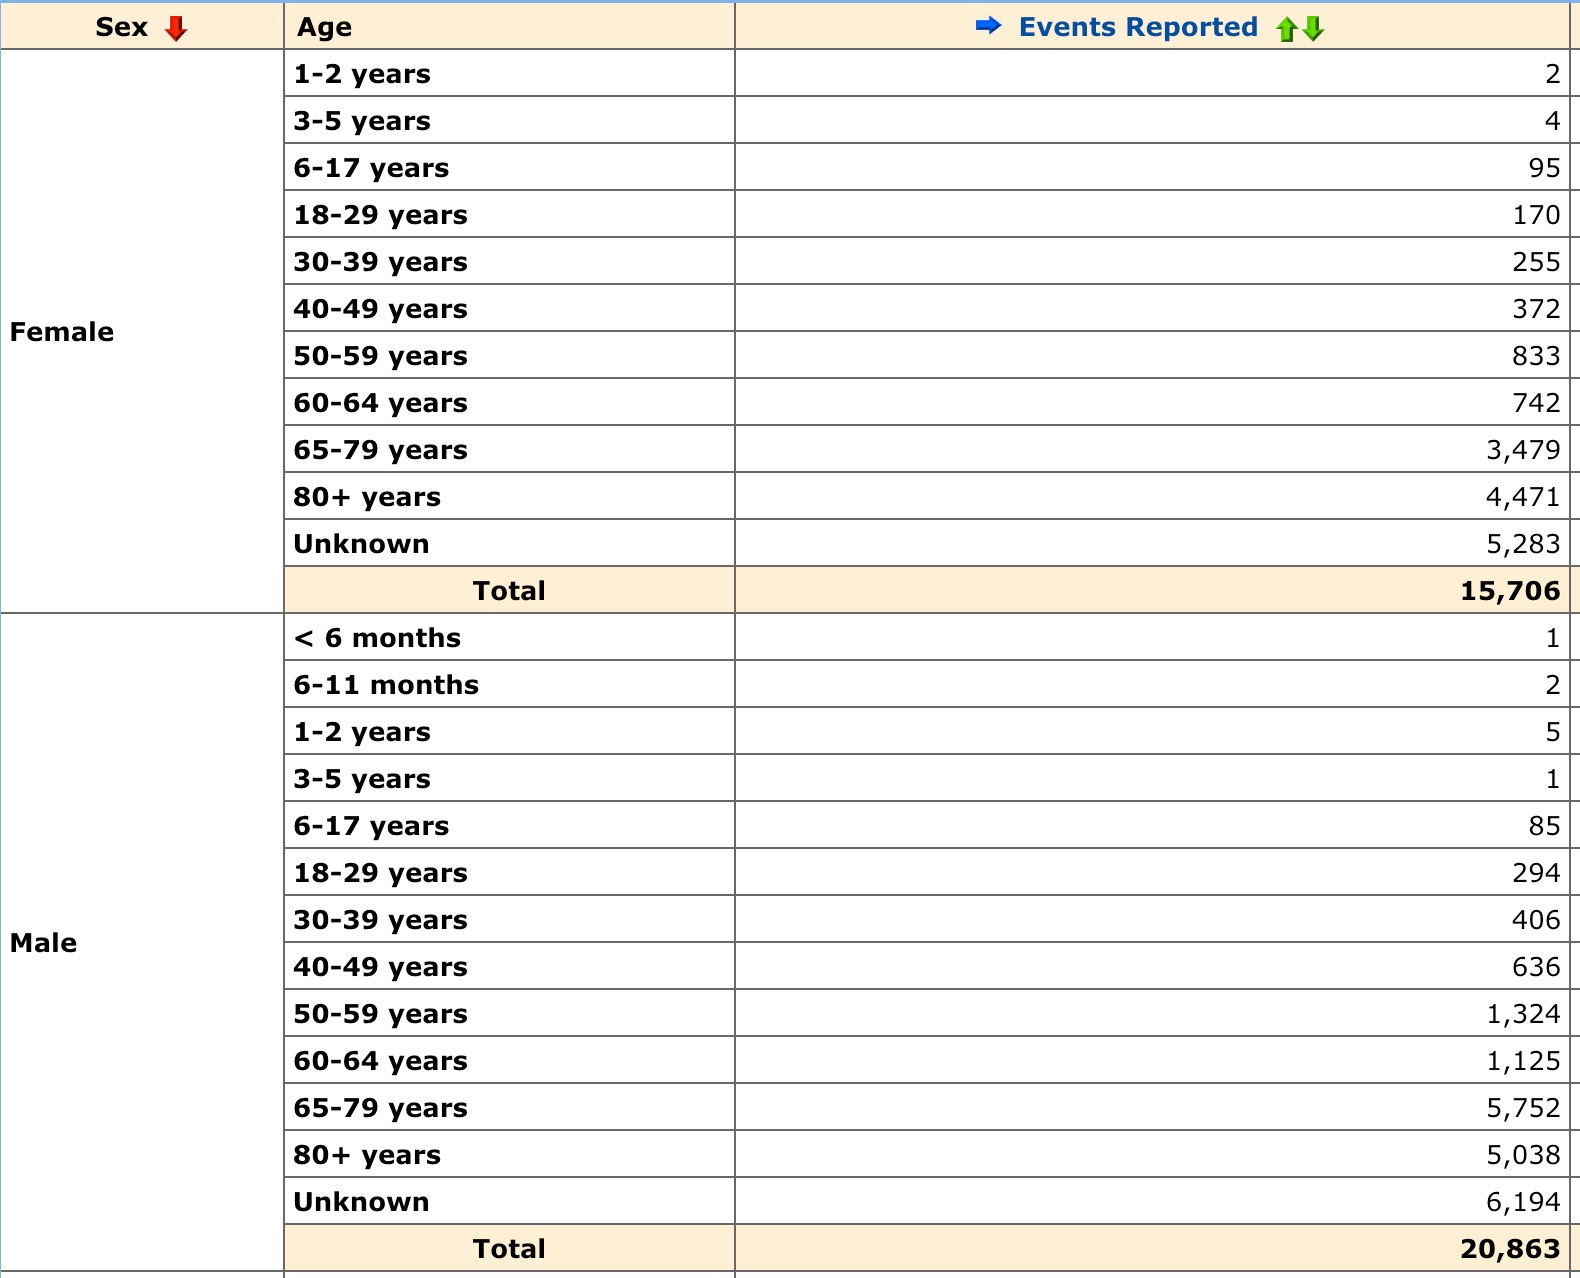
Vaccine Adverse Event Reporting System (VAERS) Permanent Disability Reports
63% of the reports of permanent disability are in women.

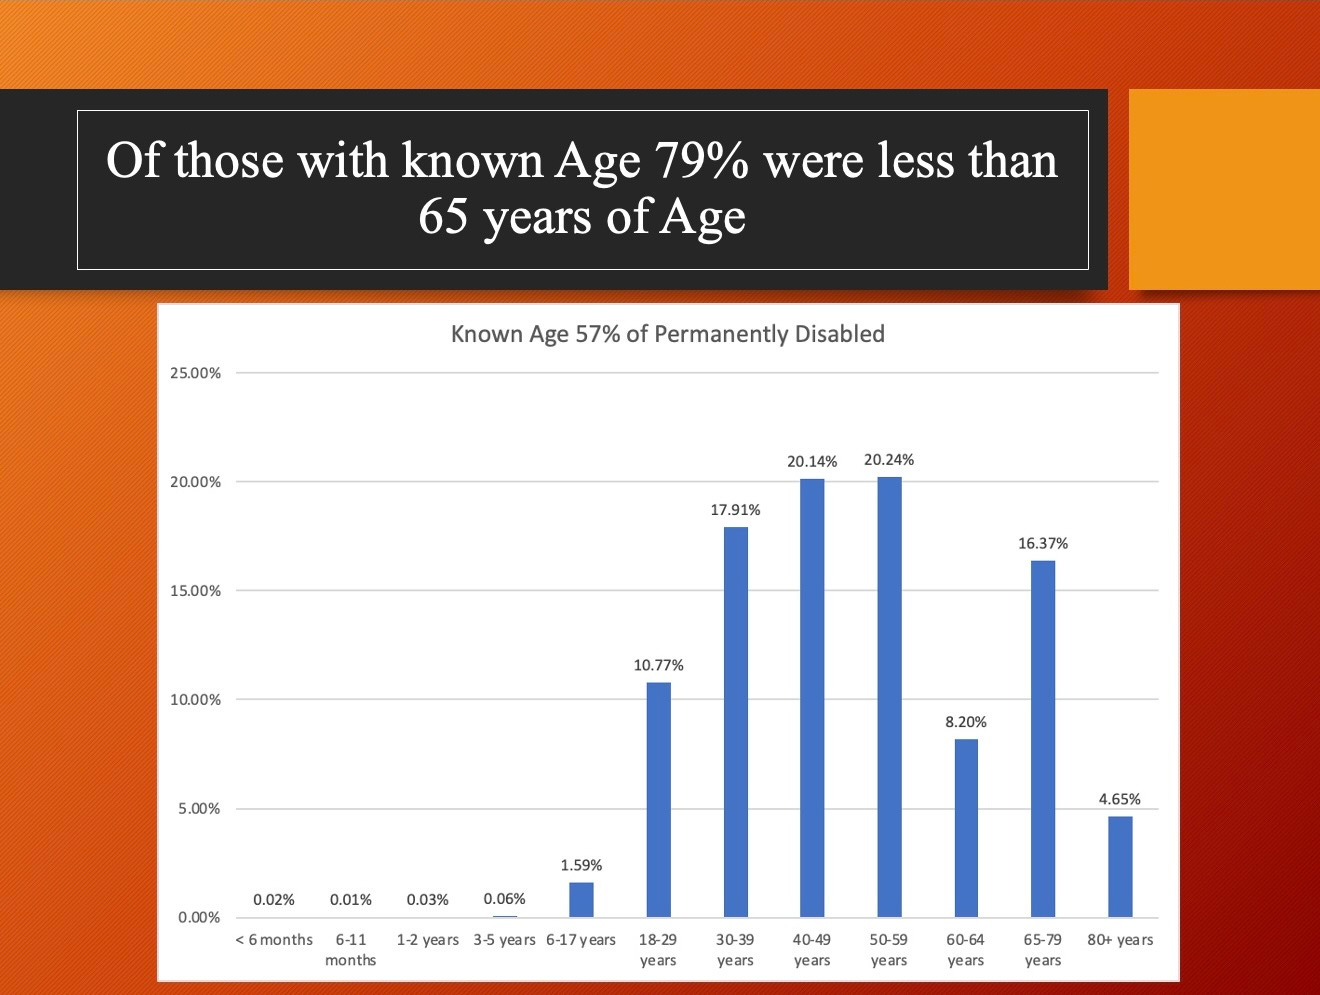
The number of cases with no age was 43% of the total of 72,501. Looks like a smokescreen on this one because almost all medical forms have age and sex on the top line. Almost 2% of permanent disability reports were for ages 17 and under including infants under 6 months.
Men may have gotten a worse deal because they have a higher percentage of fatalities.
Men had 57% of death reports.
Once again there are huge numbers (31%) of Unknown Age reports which is one method used to hide data. If anyone is taking bets I put my money on the “unknowns” being in the younger age groups.
Time to end the mRNA disaster. The Pfizer Documents Analysis Project presented our findings to Rep. Massey’s Chief of Staff 10/13/2023. This was posted on X recently. Progress!

We must begin to systematically help those with “vaccine” injuries to bring them hope and comfort.