

Vaccine Madness, Alexis Lorenze and Subversion of the Medical Profession
Unfortunately the PsyOp currently being perpetrated on its citizens by governments had to target the medical profession early on to succeed. The resultant carnage has yet to be fully appreciated.


Despite a history of vaccine injury and a severely compromised immune system due to her genetic condition, Alexis was given three vaccines all at once: tetanus, meningitis, and pneumonia. Within 10 minutes of receiving the injections, her body began to shut down.
According to Steve Kirsch, her symptoms were immediate and severe: “Within 10 minutes of the 3 vaccines which were given all at the same time, Alexis went temporarily blind in both eyes, had a locked jaw, began vomiting, and then things went horribly downhill from there.”
A cautionary note, cases like Alexis’ are complex and forensic analysis requires a thorough review of ALL documents to reach a conclusion about standard of care. Efforts must be directed at saving this young women’s life for now. Hopefully crowd sourced funding will give her access to proper medical consultants.
Government Money in Medicine
Without government money for “vaccines” Walgreens was in trouble. In the local community of 200,000 people, Walgreens stores are stuffed with inventory like alcohol, cigarettes, snack foods, soda and a plethora of other products unrelated to health but are largely devoid of customers except for an occasional person picking up their medication.


It is not only the corporate world where practices are influenced by government payments for injecting “vaccines”. Doctors struggling to keep their small business afloat during “Covid” could make ends meet testing for SAR-CoV-2 and injecting Gene Therapy Products. If financial incentives were not successful to achieve compliance with government directives, there was harassment and intimidation.

“This guidance makes clear that private group health plans and issuers generally cannot use medical screening criteria to deny coverage for COVID-19 diagnostic tests for individuals with health coverage who are asymptomatic and who have no known or suspected exposure to COVID-19,” CMS states in a news release.
As long as such testing is administered or referred by a licensed or authorized healthcare provider, it “must be covered without cost sharing, prior authorization or other medical management requirements imposed by the plan or issuer.”
Testing during this time period used RT-PCR amped up over 30 cycles making the results highly questionable. This form of testing was abandoned by the CDC in December of 2021 because it was unreliable.
The whole industry that has cropped up to do clinical trials for pharmaceuticals and specifically biologics like the gene therapy products needs careful study. As an example, the Pfizer clinical investigators’ case reports are totally inadequate judged according to standards of medical practice.
The protocol for the phase 2/3 clinical trial for Pfizer’s BNT162b2 called for three blood draws of five tubes of blood per draw. There were over 40,000 subjects in the trial. The results of the ~600,000 specimens taken have never been released. The number of individual results is in the millions. Animal studies like 20GR142 in the Pfizer documents identified elevated counts of polymorphonuclear cells (inflammation), decreased lymphocyte counts (immune suppression), decreased red cell counts, elevated fibrinogen (clotting), and decreased albumen:globulin ratios.
The point of the animal studies is to identify what to look for in the lab studies of humans during the testing phase. These results were not released in the Pfizer documents dump. It is not known whether they were even done.
Add this to poor clinical documentation, unblinding of the controls in the phase 2/3 clinical trial, the disastrous results contained in document 5.3.6 from February 28, 2021, the lack of scientifc surveillance post marketing, the absence of autopsies with histopathology and immunohistochemisty all add up to justification to terminate use of spike generating injectibles in early 2021.
Consequences

According to Pew research, the number of U.S. adults who place confidence in medical scientists to act in the best interests of the public declined from 40% in 2020 to 29% in 2022. A 2021 survey by the American Board of Internal medicine likewise found that one in six people—including physicians—no longer trust doctors, and one in three do not trust the healthcare system. Almost half the population does not trust our public health agencies to act in our interests.
Not too surprising the public has had it with the medical profession after the lunacy of Covid19 lock-downs, masking, social distancing, Plexiglas shields, closure of business and schools, and the flawed platform, poorly tested, toxic and ineffective gene therapy products.
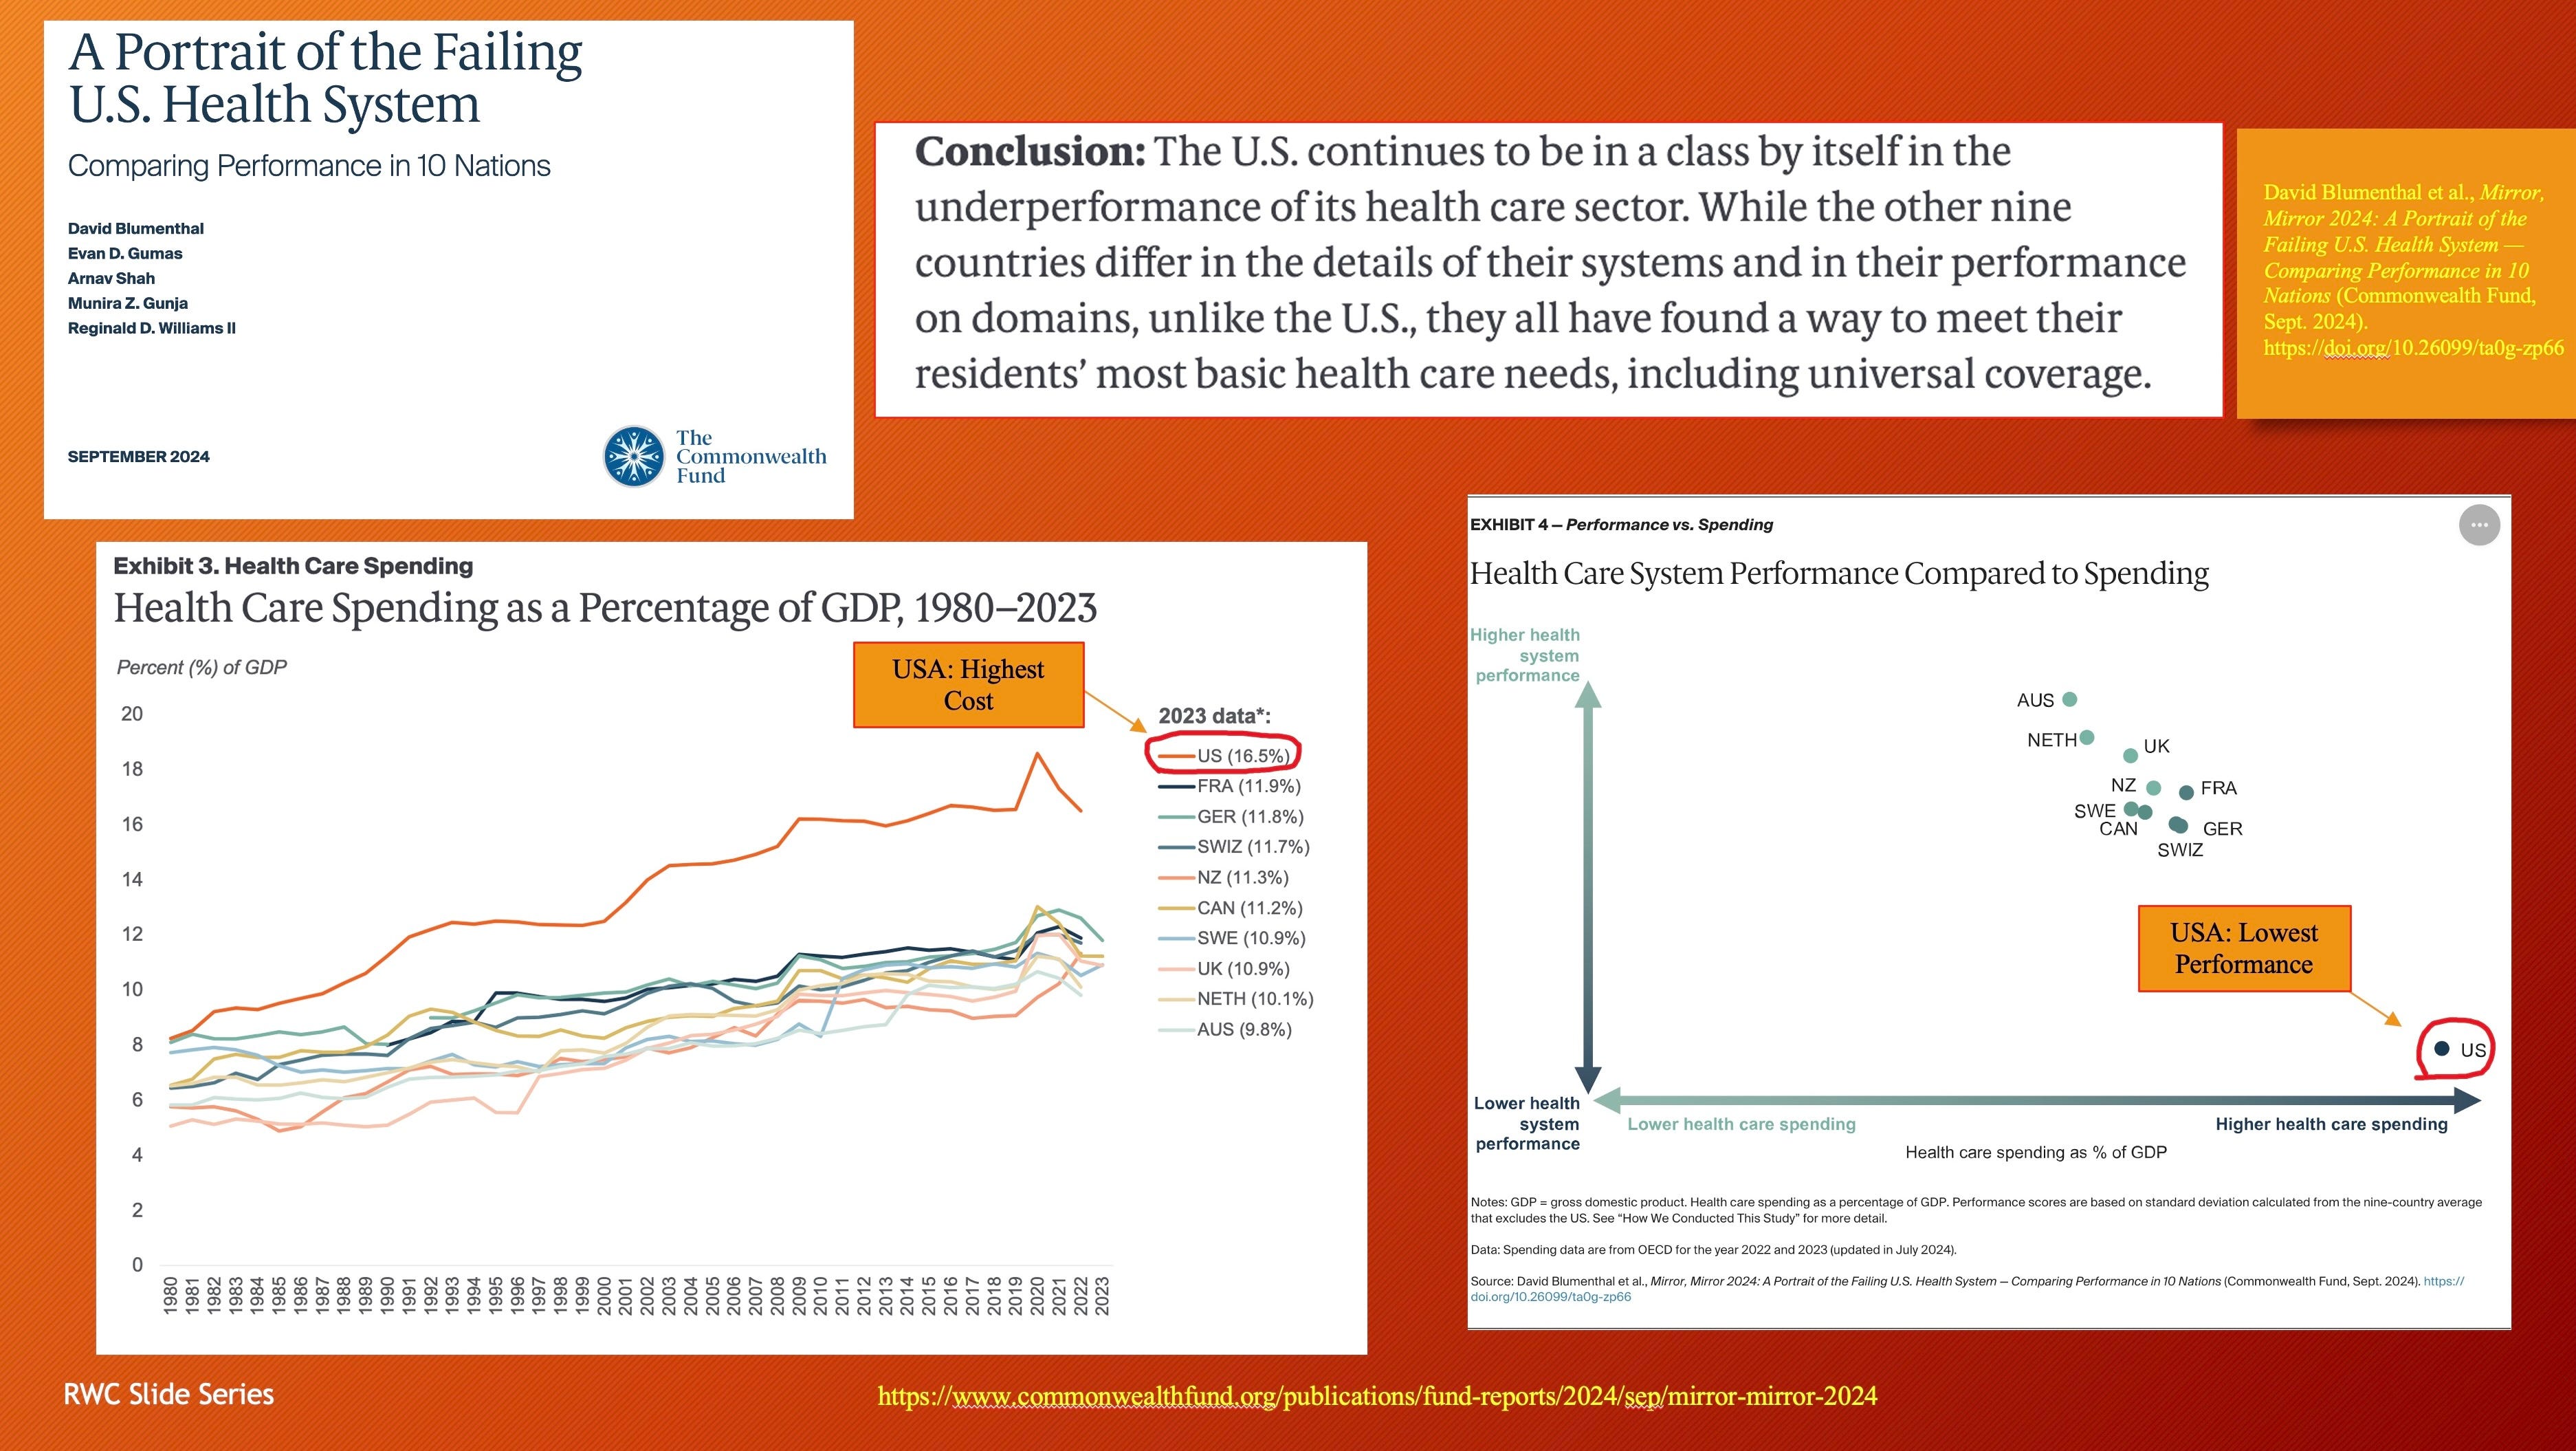
Not only has there been a credibility issue with the medical profession but a recent analysis of healthcare systems by the Commonwealth Fund found the United States at the bottom in terms of performance but highest in cost.
A future in which government controlled, poorly trained doctors who resort to Artificial Intelligence for diagnosis and treatment plans according to approved government protocols is where this is headed.
Shortages will increase as resources become strained. Physician extenders will replace physicians to a greater extent. Already patients are adjusting to seeing providers with two years of education and training rather than 6-10 years.
To deal with the “pandemic” doctors became testers and vaccinators at the direction of the federal government while under control of local health departments that policed medical offices to verify “masking”.
Economic threats, harassment and intimidation led to physicians denying early care to patients sick with respiratory viral illnesses. Then came incentives to inject the unsafe and ineffective gene therapy products. Government controlled health care is not good health care.
The good that remains in medical practice must be preserved and expanded without government interference.
Excellent question. Not at all a gotcha. You raise important issues that should not be ignored. Refusal to give up data sets on request is an important topic. You are not the first to run into this roadblock. This matter should be settled in a collegial manner as progress is made through cooperation and competition not suppression.
These are some additional issues I have with the approach used in Denmark 1 and 2. I missed Max’s presentation at D4CE meeting featured in the video, so I missed an opportunity to ask him directly. These are meant to be discussion points.
1. Methodology: log transformation, hierarchical followed by non-hierarchical cluster analysis then linear regression. Does this lead to similar very discrete clusters across multiple data sets? Independent reproducibility is important. What distortions are introduced with this methodology?
2. Why in the regression for the Blue cluster in Denmark #1 are the top four data points not included in the regression? The answer, I believe, has to do with requiring the regression to originate from the 0 point since there can be no SAEs (Deaths, Severe etc.) if no drug is administered. Including those points would move the x-axis intercept into positive territory, i.e., SAEs with no drug administered. I am just putting a ruler on those points and would like to run the numbers to see but without requiring a 0 origin to see if including those four points displaces the x intercept. Is non-linearity involved?
3. The yellow data set in Denmark #1 is hard to explain since there are SAEs, severe SAEs, and deaths in even in saline placebo groups. So, zero SAEs etc. makes no sense to me. Denmark #2 with the steeper slopes points to a process issue. Remember the kerfuffle over the word "placebo"?
4. The 89 cases need to be accounted for. This might tell us more about the international data corruption process. Hopefully you will get the data and sort out what happened.
5. Why are the slopes so different between Sweden and Denmark if there are truly three clusters with very high R2 but vary across countries? There is more going on than batch differences.
6. Why are the death plots unlike the others? Hot lots should have more deaths.
7. How sound are the time series by proxy plots since the date of release is not the date of administration? US vaxx administration data is highly granular, by daily by county as I remember. Fortunately, I was able to locate CDC data by month of administration for my time series analysis.
My takeaways: Early batches were very dirty and had a profound affect on women. (Geoff Pain just posted a piece on this topic) I believe this is because Process 2 produced a new drug formulation that had very limited testing and something in the formulation changed, other than the shift to a Tris buffer.
BioNTech/PFE knew from animal testing with BNT162b1 and the many versions of BNT162b2 through version 9 that the different formulations produced significant differences in “reactogenicity”. This is documented in the preclinical and phase 1 studies. Reactogenicity in some/many cases foretells significant health problems downstream (my opinion).
The final point is that the Denmark study was intended as preliminary to hypothesis testing research design. Unfortunately, governments around the world have taken away our most powerful tools to study the effects of these drugs leaving us with these flawed passive databases.
Bob, we are all thankful for your thorough research into this debacle. You, Malone and Wolfe have opened my eyes and heart (pun intended).
Jim S